Venn Diagram Complete Syllabus
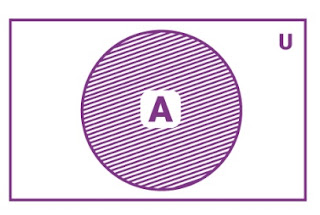
a graphic that shows every potential relationship between various sets. Any closed figure, be it a circle or a polygon (square, hexagon, etc.), can be used to depict a Venn diagram. However, we typically represent each set with a circle.
A rectangular shape in the above figure represents a Venn diagram around the universal set, which consists of two independent sets, X and Y. X and Y are thus disjoint sets. A circle is used to represent the two sets, X and Y. This diagram demonstrates that although sets X and Y are unrelated to one another, they are both a part of a universal set.
Out of 100 respondents, 60 preferred tea, 40 preferred coffee, and 20 preferred both tea and coffee. How many people didn't enjoy either coffee or tea?
Subtract from the total number surveyed the total number of people who liked either tea or coffee (or both) to determine the number of people who liked neither tea nor coffee:
Total number of respondents − (Number of tea lovers + Number of coffee lovers − Number of people who enjoyed both)
Total surveyed - (Number of tea lovers + Number of coffee lovers - Number of people who enjoyed both) = 100 − (60 + 40 - 20)
= 100 - 80 = 20
= 100−(60+40 - 20)
= 100−80
=20
Thirty students play football, twenty-five play cricket, and fifteen play both football and cricket in a class of fifty. How many pupils just play cricket?
Answer 2: Subtract the number of students who play football and cricket from the total number of cricket players to determine the number of students who play cricket exclusively.
Number of cricket players − Number of cricket players who also play football
Number of cricket players −Number of players who play football and cricket together = 25 −15 = 10 = 25 −15 = 10
Ten students play cricket exclusively.
Out of eighty, forty-five like apples, thirty-five like oranges, and twenty like both apples and oranges. What percentage of people prefer oranges over apples, but not both?
Answer 3: Subtract the number of people who enjoy both fruits from the total number of people who enjoy either fruit to determine the proportion of people who enjoy either apple or orange but not both:
(Number of apples liked − Number of both liked) + (Number of oranges liked − Number of both liked)
(Number of apples lovers - Number of orange lovers) + (Number of orange lovers - Number of both lovers) = (45 - 20) + (35 - 20) = 25 + 15 = 40 = (45 - 20) + (35 - 20) = 25 + 15 = 40
Thus, forty individuals prefer oranges or apples, but not both.
Venn diagrams are diagrams that are used to visually represent sets, relationships between sets, and operations on them. The Venn diagram, first presented by John Venn in 1834–1883, illustrates the relationship between sets using three types of circles: overlapping, intersecting, and non-intersecting. A Venn diagram, which illustrates various set operations like the intersection, union, and difference of sets, is also known as a set diagram or a logic diagram. Subsets of a set can also be represented with it.
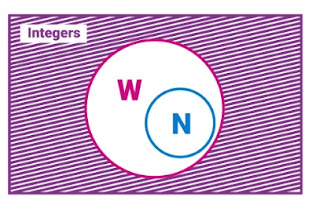
A subset of whole numbers, which is a subset of integers, is a set of natural numbers, for instance.


